 NEET Notes
Home > Biology > Botany > Organisms and Populations
Organisms and Populations
On this page · 20 sections
- 01Syllabus map
- 02Ecology and the levels of organisation
- 03What is a population?
- 04Population attributes: birth and death rates
- 05Sex ratio and age pyramids
- 06Population density and how it is measured
- 07Table 1: Population attributes at a glance
- 08Population growth: the four processes
- 09Exponential growth
- 10Logistic growth
- 11Table 2: Exponential growth vs logistic growth
- 12Life history variation
- 13Population interactions: the six outcomes
- 14Table 3: The six interspecific interactions
- 15Predation
- 16Table 4: Defences against predators
- 17Competition and Gause
- 18Parasitism
- 19Commensalism and mutualism
- 20Trap pairs: the confusions NEET tests
Population attributes, growth curves and the six species interactions, all from NCERT Chapter 11, with the PYQs NEET repeats.
Syllabus map
- NMC Unit: BIO-U10, Ecology and Environment. NCERT Chapter 11, Organisms and Populations (Class XII).
- Subtopics in this chapter (NCERT XII, Ch 11): populations (11.1); population attributes (11.1.1); population growth (11.1.2); life history variation (11.1.3); population interactions (11.1.4).
- Subtopic checklist: (1) what a population is; (2) birth rate and death rate, per capita; (3) sex ratio and age pyramids; (4) population density and how it is measured; (5) the four processes, natality, mortality, immigration, emigration; (6) exponential growth and the intrinsic rate of natural increase; (7) logistic growth and carrying capacity; (8) life history variation; (9) the six interspecific interactions and their signs; (10) predation and prey defences; (11) competition and Gause's Competitive Exclusion Principle; (12) parasitism; (13) commensalism and mutualism.
- Extra information (beyond NCERT): none. Everything in this chapter is NCERT Chapter 11.
- Estimated revision time: 10 minutes.
Ecology and the levels of organisation
Ecology is a subject which studies the interactions among organisms and between the organism and its physical (abiotic) environment.
Ecology is basically concerned with four levels of biological organisation: organisms, populations, communities and biomes. This chapter explores ecology at the population level.
There are two types of questions in ecology. The how-type questions seek the mechanism behind the process, and the why-type questions seek the significance of the process. A bulbul sings in the morning: the how-type question asks how the bird sings, the why-type question asks why the bird sings.
An individual organism is the smallest unit of the ecological hierarchy, and it copes with a changed environment. It is at the population level that natural selection operates to evolve the desired traits. Population ecology is therefore an important area of ecology because it links ecology to population genetics and evolution.
What is a population?
A population is a group of individuals of a species sharing or competing for similar resources in a defined geographical area. Members of the population may interbreed, and the population is an interbreeding group.
Examples of populations: cormorants in a wetland, rats in an abandoned dwelling, teakwood trees in a forest tract, bacteria in a culture plate, lotus plants in a pond.
A group of individuals resulting from asexual reproduction is also generally considered a population for ecological studies.
Members of a population share resources, compete for them, and are adapted to the same habitat. The size of a population is called population density, designated as N.
Population attributes: birth and death rates
An individual has births and deaths. A population has birth rates and death rates. These rates are expressed as change in numbers with respect to members of the population, that is, per capita rates.
In a pond there were 20 lotus plants last year, and through reproduction 8 new plants were added, taking the current population to 28. The birth rate is 8/20 = 0.4 offspring per lotus per year.
In a laboratory population of fruitflies, if there were 40 fruitflies in the population, and 4 died in a week, the death rate is 4/40 = 0.1 individuals per fruitfly per week.
Birth rate and death rate are therefore per capita changes: births per individual per unit time, and deaths per individual per unit time.
Practice1 question
Try it now. A wrong answer costs nothing here, try again until you get it.
In a pond there were 20 lotus plants last year, and through reproduction 8 new plants were added. What is the birth rate?
NCERT 11.1.1: birth rate is per capita, 8/20 = 0.4 offspring per lotus per year.
Sex ratio and age pyramids
Another attribute characteristic of a population is sex ratio. An individual is either a male or a female, but a population has a sex ratio: for example, 60 per cent of the population are females and 40 per cent are males.
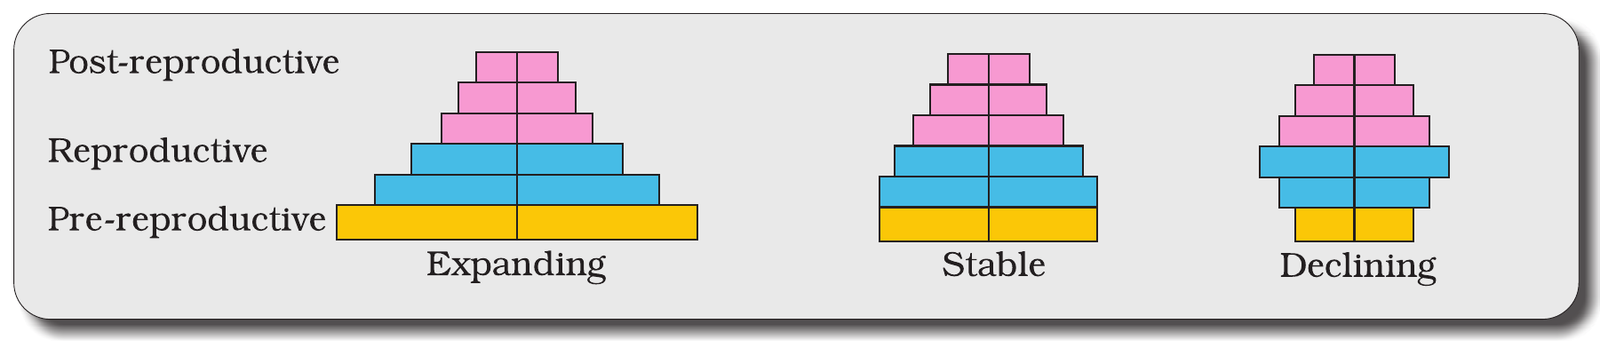
A population at any given time is composed of individuals of different ages. If the age distribution (per cent individuals of a given age or age group) is plotted for the population, the resulting structure is called an age pyramid.
For the human population, the age pyramids generally show age distribution of males and females in a combined diagram. The shape of the pyramids reflects the growth status of the population:
- Growing (expanding): the per cent of individuals of pre-reproductive age is largest, followed by reproductive and post-reproductive age groups.
- Stable: the per cent of individuals of pre-reproductive and reproductive age groups is nearly the same.
- Declining: the pre-reproductive age group is smallest.
(NCERT Fig. 11.1) shows the three age pyramid shapes: expanding, stable and declining.
Population density and how it is measured
The size of the population tells us a lot about its status in the habitat. Whatever ecological processes we wish to investigate in a population, be it the outcome of competition with another species, the impact of a predator, or the effect of a pesticide application, we always evaluate them in terms of any change in the population size.
The size, in nature, could be as low as less than 10 (Siberian cranes at Bharatpur wetlands in any year) or go into millions (Chlamydomonas in a pond).
Population size, technically called population density (designated as N), need not necessarily be measured in numbers only. In an area, if there are 200 carrot grass (Parthenium hysterophorus) plants but only a single huge banyan tree with a large canopy, stating that the population density of banyan is low relative to that of carrot grass amounts to underestimating the enormous role of the banyan in that community. In such cases, the per cent cover or biomass is a more meaningful measure of the population size.
Total number is again not an easily adoptable measure if the population is huge and counting is impossible or very time-consuming. If you have a dense laboratory culture of bacteria in a petri dish, what is the best measure to report its density?
Sometimes, for certain ecological investigations, there is no need to know the absolute population densities. Relative densities serve the purpose equally well. For instance, the number of fish caught per trap is good enough measure of its total population density in the lake.
We are mostly obliged to estimate population sizes indirectly, without actually counting them or seeing them. The tiger census in our national parks and tiger reserves is often based on pug marks and fecal pellets.
Table 1: Population attributes at a glance
| Attribute | What it means | NCERT example |
|---|---|---|
| Birth rate | Per capita births: new individuals per individual per unit time | 8 new lotus from 20 lotus = 0.4 offspring per lotus per year |
| Death rate | Per capita deaths: deaths per individual per unit time | 4 deaths in 40 fruitflies in a week = 0.1 per fruitfly per week |
| Sex ratio | Per cent males and females in the population | 60 per cent females and 40 per cent males |
| Age pyramid | Shape of the age distribution shows the growth status | Expanding, stable, declining (Fig. 11.1) |
| Population density (N) | Size of the population, in numbers, biomass, per cent cover or relative density | Siberian cranes less than 10 at Bharatpur; Chlamydomonas in millions; tiger census by pug marks and fecal pellets |
Source: NCERT XII, Ch 11, 11.1.1.
Population growth: the four processes
The size of a population for any species is not a static parameter. It keeps changing with time, depending on various factors including food availability, predation pressure and adverse weather. It is these changes in population density that give us some idea of what is happening to the population: whether it is flourishing or declining.
The density of a population in a given habitat during a given period fluctuates due to changes in four basic processes. Two of these (natality and immigration) contribute to an increase in population density, and two (mortality and emigration) to a decrease.
- (i) Natality refers to the number of births during a given period in the population that are added to the initial density.
- (ii) Mortality is the number of deaths in the population during a given period.
- (iii) Immigration is the number of individuals of the same species that have come into the habitat from elsewhere during the time period under consideration.
- (iv) Emigration is the number of individuals of the population who left the habitat and gone elsewhere during the time period under consideration.
So, if N is the population density at time t, then its density at time t + 1 is
Nt+1 = Nt + [(B + I) - (D + E)]
You can see from the above equation (NCERT Fig. 11.2) that population density will increase if the number of births plus the number of immigrants (B + I) is more than the number of deaths plus the number of emigrants (D + E).
Under normal conditions, births and deaths are the most important factors influencing population density, the other two factors assuming importance only under special conditions. For instance, if a new habitat is just being colonised, immigration may contribute more significantly to population growth than birth rates.
Practice1 question
Try it now. A wrong answer costs nothing here, try again until you get it.
Which two of the four basic processes increase population density?
NCERT 11.1.2: natality (B) and immigration (I) increase density; mortality (D) and emigration (E) decrease it.
Exponential growth
Growth Models: Does the growth of a population with time show any specific and predictable pattern? We have been concerned about unbridled human population growth and the problems created by it in our country, and it is therefore natural for us to be curious if different animal populations in nature behave the same way or show some restraints on growth.
(i) Exponential growth: Resource (food and space) availability is obviously essential for the unimpeded growth of a population. Ideally, when resources in the habitat are unlimited, each species has the ability to realise fully its innate potential to grow in number, as Darwin observed while developing his theory of natural selection. Then the population grows in an exponential or geometric fashion.
If in a population of size N, the birth rates (not total number but per capita births) are represented as b and death rates (again, per capita death rates) as d, then the increase or decrease in N during a unit time period t (dN/dt) will be
dN/dt = (b - d) x N
Let (b - d) = r, then
dN/dt = rN
The r in this equation is called the intrinsic rate of natural increase and is a very important parameter chosen for assessing impacts of any biotic or abiotic factor on population growth.
To give you some idea about the magnitude of r values, for the Norway rat the r is 0.015, and for the flour beetle it is 0.12. In 1981, the r value for the human population in India was 0.0205.
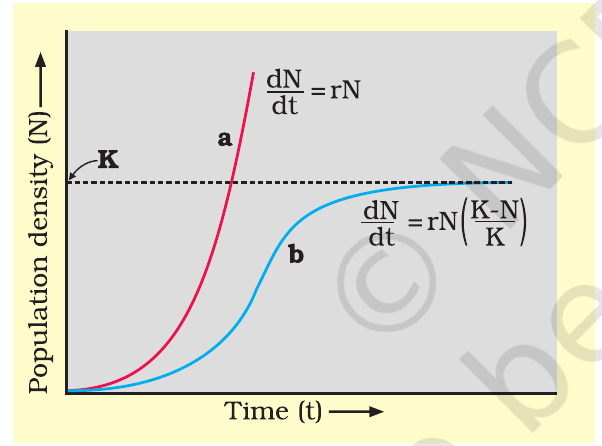
The above equation describes the exponential or geometric growth pattern of a population (Fig. 11.3) and results in a J-shaped curve when we plot N in relation to time.
If you are familiar with basic calculus, you can derive the integral form of the exponential growth equation as
Nt = N0 e^(rt)
where Nt = population density after time t, N0 = population density at time zero, r = intrinsic rate of natural increase, e = the base of natural logarithms (2.71828).
Any species growing exponentially under unlimited resource conditions can reach enormous population densities in a short time.
Logistic growth
(ii) Logistic growth: No population of any species in nature has at its disposal unlimited resources to permit exponential growth. This leads to competition between individuals for limited resources. Eventually, the fittest individuals will survive and reproduce.
A given habitat has enough resources to support a maximum possible number, beyond which no further growth is possible. That limit is called carrying capacity (K) for that species in that habitat.
A population growing in a habitat with limited resources shows initially a lag phase, followed by phases of acceleration and deceleration, and finally an asymptote, when the population density reaches the carrying capacity.
A plot of N in relation to time gives a sigmoid curve. This type of population growth is called Verhulst-Pearl Logistic Growth, and is described by the following equation:
dN/dt = rN((K - N)/K)
where N = population density at time t, r = intrinsic rate of natural increase, K = carrying capacity.
Since resources for growth for most animal populations are finite and become limiting sooner or later, the logistic growth model is considered a more realistic one.
Practice1 question
Try it now. A wrong answer costs nothing here, try again until you get it.
In the logistic growth equation dN/dt = rN((K - N)/K), what is K?
NCERT 11.1.2: K is the carrying capacity, the maximum possible number the habitat can support.
Table 2: Exponential growth vs logistic growth
| Feature | Exponential growth | Logistic growth |
|---|---|---|
| Resource condition | Unlimited resources | Limited resources |
| Differential equation | dN/dt = rN | dN/dt = rN((K - N)/K) |
| Integral form | Nt = N0 e^(rt) | No integral form given in NCERT |
| Curve shape | J-shaped curve (a in Fig. 11.3) | Sigmoid curve (b in Fig. 11.3) |
| Phases | None | Lag, acceleration, deceleration, asymptote at K |
| Carrying capacity (K) | Not reached | Population levels off at K |
| Realism | Ideal, as Darwin observed | More realistic for most animal populations |
Source: NCERT XII, Ch 11, 11.1.2, Fig. 11.3.
Life history variation
Populations evolve to maximise their reproductive fitness, also called Darwinian fitness (high r value), in the habitat in which they live. Under a particular set of selection pressures, organisms evolve towards the most efficient reproductive strategy.
Some organisms breed only once in their lifetime (Pacific salmon fish, bamboo) while others breed many times during their lifetime (most birds and mammals).
Some produce a large number of small-sized offspring (oysters, pelagic fishes) while others produce a small number of large-sized offspring (birds, mammals).
Which, do you think, is a more realistic strategy for a given environment? How you answer this question depends on the evolutionary pressures acting on the organism.
Life history traits of organisms have evolved in relation to the constraints imposed by the abiotic and biotic components of the habitat in which they live.
Population interactions: the six outcomes
In nature, animals, plants and microbes do not and cannot live in isolation but interact in various ways to form a biological community. Even a plant species, which makes its own food, cannot survive alone. It needs soil microbes to break down the organic matter in soil and return the inorganic nutrients for absorption. And then, how will the plant manage pollination without an animal agent? It is obvious that in nature, plants, animals and microbes interact.
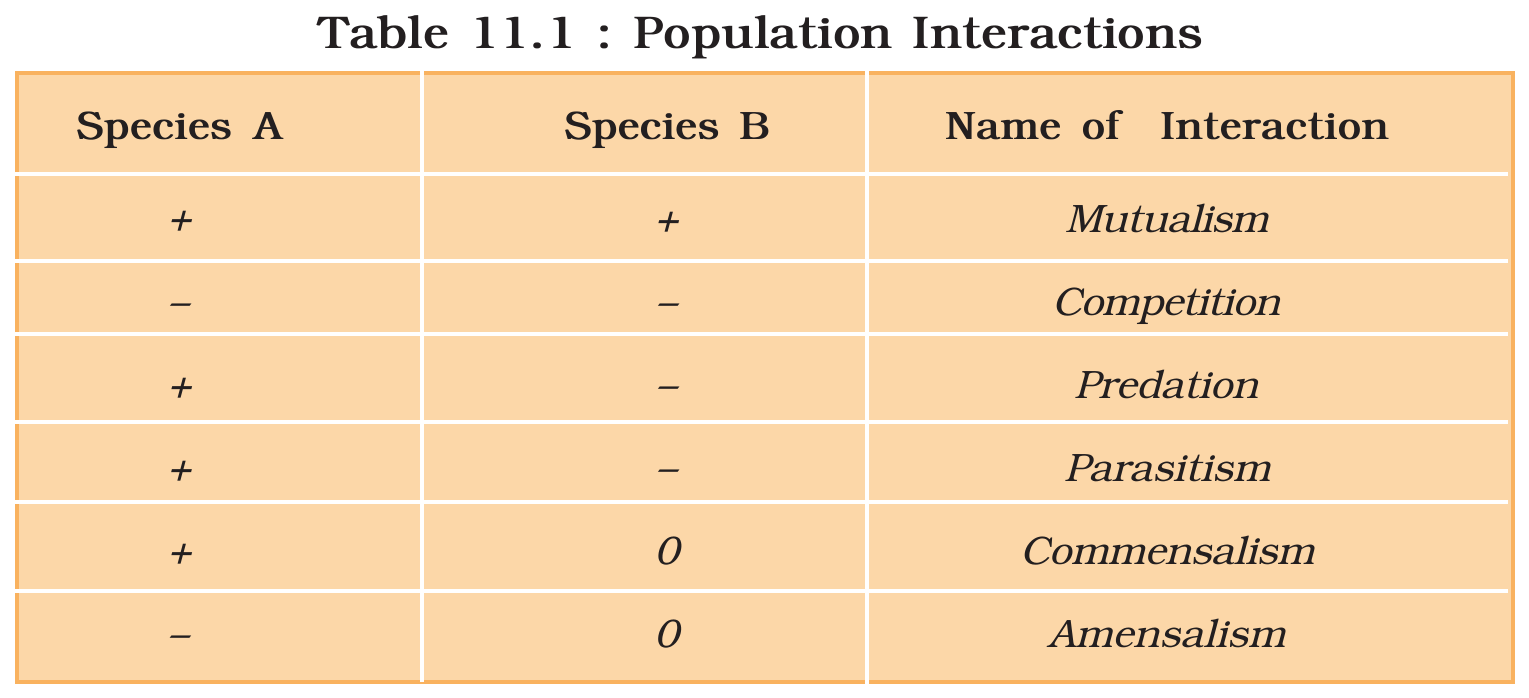
Interspecific interactions arise from the interaction of populations of two different species. They could be beneficial (+), detrimental (-) or neutral (0) to one of the species or both. Assigning a + sign for beneficial interaction, - sign for detrimental and 0 for neutral interaction, we can see that all possible combinations are shown in Table 11.1.
Both the species benefit in mutualism, and both lose in competition. In both parasitism and predation only one species benefits (parasite and predator respectively), and the interaction is detrimental to the other species.
The interaction where one species is benefitted and the other is neither benefitted nor harmed is called commensalism. In amensalism, on the other hand, one species is harmed whereas the other is unaffected.
Predation, parasitism and commensalism share a common characteristic: the interacting species live closely together.
Table 3: The six interspecific interactions
| Species A | Species B | Name of interaction |
|---|---|---|
| + | + | Mutualism |
| - | - | Competition |
| + | - | Predation |
| + | - | Parasitism |
| + | 0 | Commensalism |
| - | 0 | Amensalism |
+ is beneficial, - is detrimental, 0 is neutral. In predation and parasitism only one species benefits; in commensalism one benefits and the other is unaffected; in amensalism one is harmed and the other is unaffected.
Source: NCERT XII, Ch 11, 11.1.4, Table 11.1.
Predation
(i) Predation: In nature, one of the ways in which plants and animals are able to survive is through the process of predation. A sparrow eating any seed is no less a predator. In the broadest ecological context, all herbivores are predators.
Predation is a process by which energy fixed by plants is transferred to higher trophic levels. Besides acting as conduits for energy transfer across trophic levels, predators play other important roles. They keep prey populations under control. But for predators, prey species could achieve very high population densities and cause ecosystem instability.
When certain exotic species are introduced into a geographical area, they become invasive and start spreading fast because the invaded land does not have its natural predators. The prickly pear cactus introduced into Australia in the early 1920s caused havoc by spreading rapidly into millions of hectares of rangeland. Finally, the invasive cactus was brought under control only after a cactus-feeding predator (a moth) from its natural habitat was introduced into the country.
Biological control methods adopted in agricultural pest control are based on the ability of the predator to regulate prey population.
Predators also help in maintaining species diversity in a community, by reducing the intensity of competition among competing prey species. In the rocky intertidal communities of the American Pacific Coast, the starfish Pisaster is an important predator. In a field experiment, when all the starfish were removed from an enclosed intertidal area, more than 10 species of invertebrates became extinct within a year because of interspecific competition.
If a predator is too efficient and overexploits its prey, then the prey might become extinct and following it, the predator will also become extinct for lack of food. This is the reason why predators in nature are prudent.
To avoid being eaten by predators, prey species have evolved various defences. Nearly 25 per cent of all insects are known to be phytophagous.
Some species of insects and frogs are cryptically-coloured (camouflaged) to avoid being detected easily by the predator. Some are poisonous and therefore avoided by the predators. The Monarch butterfly is highly distasteful to its predator (bird) because of a special chemical present in its body. Interestingly, the butterfly acquires this chemical during its caterpillar stage by feeding on a poisonous weed.
For plants, herbivores are the predators. Plants have evolved an astonishing variety of morphological and chemical defences against herbivores. Thorns (Acacia, Cactus) are the most common morphological means of defence. Many plants produce and store chemicals which make the herbivore sick when they are eaten, inhibit feeding or digestion, disrupt its reproduction or even kill it. You have learnt in your chemistry classes about the chemical substances which are produced by plants like the cardiac glycosides and nicotine, caffeine, quinine, strychnine, opium, etc., that are actually defence mechanisms against grazers and browsers. The weed Calotropis growing in abandoned fields produces highly poisonous cardiac glycosides and that is why you never see any cattle or goat browsing on this plant.
Practice1 question
Try it now. A wrong answer costs nothing here, try again until you get it.
In the rocky intertidal communities of the American Pacific Coast, what happened when all the starfish Pisaster were removed from an enclosed area?
NCERT 11.1.4: with Pisaster removed, more than 10 invertebrate species became extinct within a year because of interspecific competition.
Table 4: Defences against predators
| Defence | Example | How it works |
|---|---|---|
| Camouflage | Some insects and frogs | Cryptic colouring avoids detection by the predator |
| Poisonous and distasteful | Monarch butterfly | Chemical from a poisonous weed eaten as a caterpillar makes the butterfly distasteful to birds |
| Thorns | Acacia, Cactus | Morphological means of defence against herbivores |
| Cardiac glycosides | Calotropis | Highly poisonous; cattle and goats never browse on this plant |
| Chemicals against grazers and browsers | Nicotine, caffeine, quinine, strychnine, opium | Produced by plants as defences; make the herbivore sick, inhibit feeding or digestion, disrupt reproduction or even kill it |
| Phytophagous insects | Nearly 25 per cent of all insects | Insects that feed on plants, the predators of plants |
Source: NCERT XII, Ch 11, 11.1.4.
Competition and Gause
(ii) Competition: When Darwin spoke of the struggle for existence and survival of the fittest in nature, he was convinced that interspecific competition is a potent force in organic evolution. It is generally believed that competition occurs when closely related species compete for the same resources that are limiting, but this is not entirely true.
Firstly, totally unrelated species could also compete for the same resource. For instance, in some shallow South American lakes, visiting flamingoes and resident fishes compete for their common food, the zooplankton in the lake.
Secondly, resources need not be limiting for competition to occur. In interference competition, the feeding efficiency of one species might be reduced due to the interfering and inhibitory presence of the other species, even if resources (food and space) are abundant.
Therefore, competition is best defined as a process in which the fitness of one species (measured in terms of its r, the intrinsic rate of increase) is significantly lower in the presence of another species.
It is relatively easy to demonstrate in laboratory experiments, as Gause and other experimental ecologists did, when resources are limited, the competitively superior species will eventually eliminate the other species. The Abingdon tortoise in Galapagos Islands became extinct within a decade after goats were introduced on the island, apparently due to the greater browsing efficiency of the goats.
Another evidence for the occurrence of competition in nature comes from what is called competitive release. A species whose distribution is restricted to a small geographical area because of the presence of a competitively superior species, is found to expand its distributional range dramatically when the competing species is experimentally removed.
Connell's elegant field experiments showed that on the rocky sea coasts of Scotland, the larger and competitively superior barnacle Balanus dominates the intertidal area, and excludes the smaller barnacle Chthamalus from that zone. In general, herbivores and plants appear to be more adversely affected by competition than carnivores.
Gause's Competitive Exclusion Principle states that two closely related species competing for the same resources cannot co-exist indefinitely and the competitively inferior one will be eliminated eventually. This may be true if resources are limiting, but not otherwise.
More recent studies do not support such gross generalisations about competition. While they do not rule out the occurrence of interspecific competition, they point out that species facing competition might evolve mechanisms that promote co-existence rather than exclusion. One such mechanism is resource partitioning. If two species compete for the same resource, they could avoid competition by choosing, for instance, different times for feeding or different foraging patterns. MacArthur showed that five closely related species of warblers living on the same tree were able to avoid competition and co-exist due to behavioural differences in their foraging activities.
Parasitism
(iii) Parasitism: Many parasites have evolved to be host-specific (they can parasitise only a single species of host) in such a way that both host and the parasite tend to co-evolve. That is, if the host evolves special mechanisms for rejecting or resisting the parasite, the parasite has to evolve mechanisms to counteract and neutralise them, in order to be successful with the same host species.
In accordance with their life styles, parasites evolved special adaptations such as the loss of unnecessary sense organs, presence of adhesive organs or suckers to cling on to the host, loss of digestive system and high reproductive capacity.
The life cycles of parasites are often complex, involving one or two intermediate hosts or vectors to facilitate parasitisation of its primary host. The human liver fluke (a trematode parasite) depends on two intermediate hosts (a snail and a fish) to complete its life cycle. The malarial parasite needs a vector (mosquito) to spread to other hosts.
Majority of the parasites harm the host. They may reduce the survival, growth and reproduction of the host and reduce its population density. They might render the host more vulnerable to predation by making it physically weak.
Ectoparasites feed on the external surface of the host organism. The most familiar examples of this group are the lice on humans and ticks on dogs. Many marine fish are infested with ectoparasitic copepods. Cuscuta, a parasitic plant that is commonly found growing on hedge plants, has lost its chlorophyll and leaves in the course of evolution. It derives its nutrition from the host plant which it parasitises.
The female mosquito is not considered a parasite, although it needs our blood for reproduction.
Endoparasites are those that live inside the host body at different sites (liver, kidney, lungs, red blood cells, etc.). The life cycles of endoparasites are more complex because of their extreme specialisation. Their morphological and anatomical features are greatly simplified while emphasising their reproductive potential.
Brood parasitism in birds is a fascinating example of parasitism in which the parasitic bird lays its eggs in the nest of its host and lets the host incubate them. During the course of evolution, the eggs of the parasitic bird have evolved to resemble the host's egg in size and colour to reduce the chances of the host bird detecting the foreign eggs and ejecting them from the nest. The cuckoo (koel) lays its eggs in the nest of a crow.
Commensalism and mutualism
(iv) Commensalism: This is the interaction in which one species benefits and the other is neither harmed nor benefited. An orchid growing as an epiphyte on a mango branch, and barnacles growing on the back of a whale, benefit whereas the mango tree and the whale have no benefit.
The interaction between the cattle egret and grazing cattle is a classic example of commensalism. The egrets always forage close to where the cattle are grazing because the cattle, as they move, stir up and flush out insects from the vegetation which otherwise might be difficult for the egrets to find and catch.
Another example of commensalism is the interaction between sea anemone that has stinging tentacles and the clown fish that lives among them. The fish gets protection from predators which stay away from the stinging tentacles. The anemone does not appear to derive any benefit by hosting the clown fish.
(v) Mutualism: This interaction confers benefits on both the interacting species. Lichens represent an intimate mutualistic relationship between a fungus and photosynthesising algae or cyanobacteria.
Similarly, the mycorrhizae are associations between fungi and the roots of higher plants. The fungi help the plant in the absorption of essential nutrients from the soil while the plant in turn provides the fungi with energy-yielding carbohydrates.
In general, plants need the help of animals for pollinating their flowers and dispersing their seeds. Animals obviously have to be paid fees for the services rendered. Plants offer rewards or fees in the form of pollen and nectar for pollinators and juicy and nutritious fruits for seed dispersers. But the mutually beneficial system should also be safeguarded against cheaters, for example, animals that try to steal nectar without aiding in pollination.
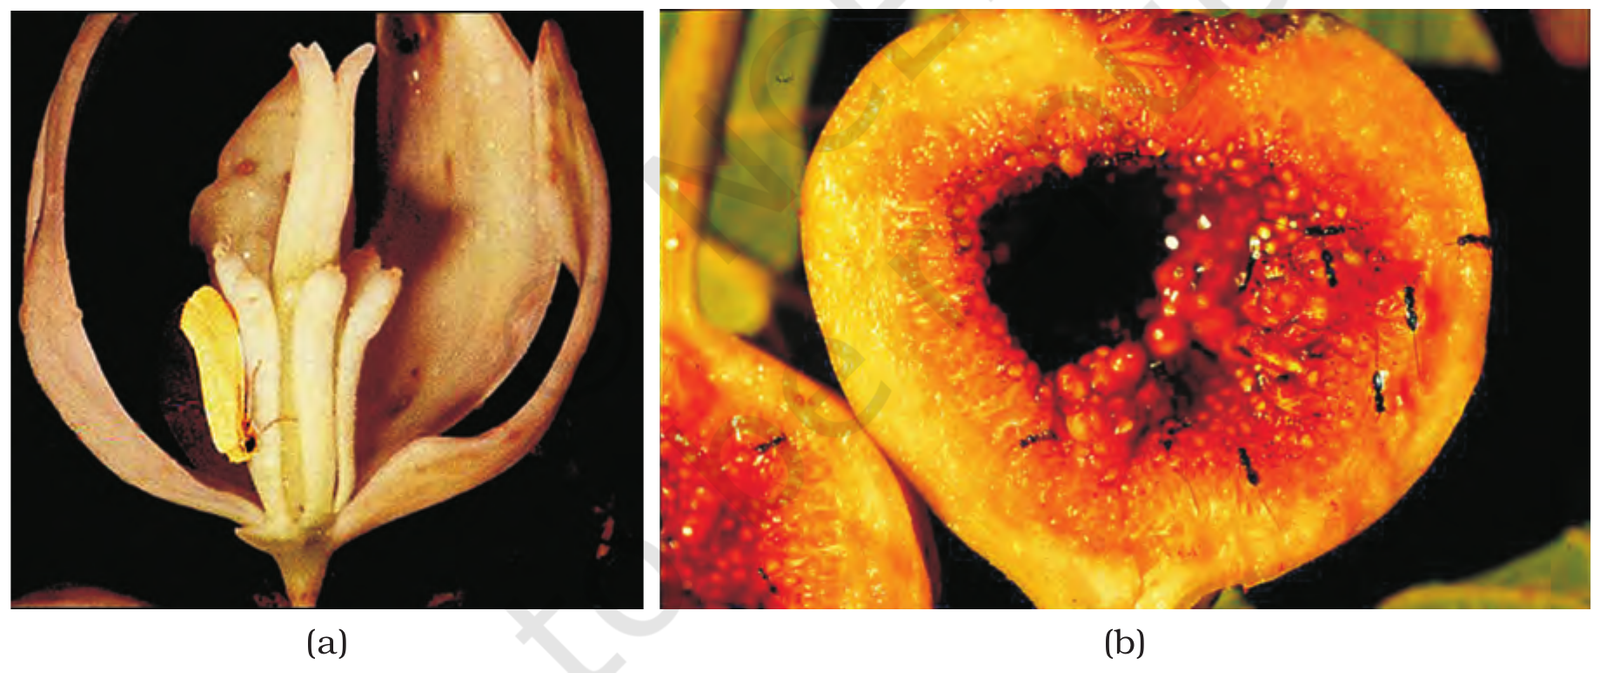
Plant-animal interactions often involve co-evolution of the mutualists, that is, the evolutions of the flower and its pollinator species are tightly linked with one another. In many species of fig trees, there is a one-to-one relationship with the pollinator species of wasp (NCERT Fig. 11.4). It means that a given fig species can be pollinated only by its partner wasp species and no other species. The female wasp uses the fruit not only as an oviposition (egg-laying) site but uses the developing seeds within the fruit for nourishing its larvae. The wasp pollinates the fig inflorescence while searching for suitable egg-laying sites.
The orchid Ophrys employs sexual deceit to get pollination done by a species of bee (NCERT Fig. 11.5). One petal of its flower bears an uncanny resemblance to the female of the bee in size, colour and markings. The male bee is attracted to what it perceives as a female, pseudocopulates with the flower, and during that process is dusted with pollen from the flower. When this same bee pseudocopulates with another flower, it transfers pollen to it and thus, pollinates the flower.
Practice1 question
Try it now. A wrong answer costs nothing here, try again until you get it.
An orchid grows as an epiphyte on a mango branch. What kind of interaction is this?
NCERT 11.1.4: the orchid benefits while the mango tree is neither harmed nor benefited, which is commensalism (+/0).
Trap pairs: the confusions NEET tests
- Commensalism (+/0) vs mutualism (+/+): in commensalism only one species benefits, the other is neither harmed nor benefited (orchid on a mango branch). In mutualism both benefit (lichen: fungus plus algae or cyanobacteria).
- Predation (+/-) vs parasitism (+/-): both are +/- but in predation the predator kills and eats the prey (tiger eating deer, sparrow eating seed); in parasitism the parasite lives on or in the host and harms it (human liver fluke, Cuscuta, lice).
- Exponential (J) vs logistic (sigmoid): exponential growth needs unlimited resources and follows dN/dt = rN; logistic growth is limited by resources, levels off at carrying capacity K and follows dN/dt = rN((K - N)/K).
- Birth rate vs births: birth rate is per capita, 0.4 offspring per lotus per year from 8 new plants on 20 lotus, not 8. Death rate is per capita too, 0.1 per fruitfly per week from 4 deaths in 40 fruitflies.
- Competition (-/-) vs amensalism (-/0): in competition both species lose (Abingdon tortoise lost to goats); in amensalism one species is harmed and the other is unaffected.
- Female mosquito vs parasite: the female mosquito needs blood for reproduction but is not considered a parasite. A parasite lives on or in the host and harms it.
Trap Boxes
Birth rate is the same as the number of births?
Wrong idea: 20 lotus plants produced 8 new plants, so the birth rate is 8.
Birth rate is per capita: 8/20 = 0.4 offspring per lotus per year. Death rate is also per capita: 4 deaths in 40 fruitflies in a week is 0.1 per fruitfly per week.
NCERT XII, Ch 11, 11.1.1
Exponential growth is what happens in nature?
Wrong idea: Populations grow exponentially in nature, so the J-shaped curve is the realistic one.
Exponential growth needs unlimited resources. In nature resources are limited, so the logistic growth model, a sigmoid curve levelling at carrying capacity K, is the more realistic one.
NCERT XII, Ch 11, 11.1.2, Fig. 11.3
Predation harms the ecosystem?
Wrong idea: Predators are harmful because they kill prey.
Predators transfer energy to higher trophic levels, keep prey populations under control and maintain species diversity. When Pisaster starfish were removed, more than 10 invertebrate species became extinct within a year from interspecific competition.
NCERT XII, Ch 11, 11.1.4
Competition happens only between closely related species?
Wrong idea: Only closely related species compete, since they need the same resources.
Totally unrelated species can compete for the same resource: visiting flamingoes and resident fishes compete for zooplankton in South American lakes. Competition is defined by lowered fitness (r) in the presence of another species.
NCERT XII, Ch 11, 11.1.4
The female mosquito is a parasite?
Wrong idea: The female mosquito takes blood from humans, so it is a parasite.
NCERT states the female mosquito is not considered a parasite, although it needs blood for reproduction. A parasite lives on or in the host; the mosquito only visits for blood.
NCERT XII, Ch 11, 11.1.4
Chapter test
5 NEET PYQs. +4 for a correct answer, -1 for a wrong answer, exactly like NEET. Finish the test to earn a medal.
Q1: NEET (UG) 2023, Code F1, Q191
Match List I with List II.
| List I | List II |
|---|---|
| A. Logistic growth | I. Unlimited resource availability condition |
| B. Exponential growth | II. Limited resource availability condition |
| C. Expanding age pyramid | III. The percent individuals of pre-reproductive age is largest followed by reproductive and post reproductive age groups |
| D. Stable age pyramid | IV. The percent individuals of pre-reproductives and reproductive age group are same |
Choose the correct answer from the options given below:
Logistic growth happens when resources are limited, exponential growth when they are unlimited. In an expanding pyramid the pre-reproductive group is largest; in a stable pyramid the pre-reproductive and reproductive groups are the same.
Q2: NEET (UG) 2023, Code F1, Q140
Match List I with List II :
| List I (Interaction) | List II (Species A and B) |
|---|---|
| A. Mutualism | I. +(A), 0(B) |
| B. Commensalism | II. -(A), 0(B) |
| C. Amensalism | III. +(A), -(B) |
| D. Parasitism | IV. +(A), +(B) |
Choose the correct answer from the options given below:
NCERT Table 11.1: mutualism +/+, commensalism +/0, amensalism -/0, parasitism +/-. So A-IV, B-I, C-II, D-III.
Q3: NEET (UG) 2022, Code R1, Q142
While explaining interspecific interaction of population, (+) sign is assigned for beneficial interaction, (-) sign is assigned for detrimental interaction and (0) for neutral interaction. Which of the following interactions can be assigned (+) for one specifies and (-) for another specifies involved in the interaction ?
Predation is +/-, one species benefits (the predator) and the other is harmed (the prey). Parasitism is also +/-, but it is not among the options. Competition is -/-, commensalism +/0.
Q4: NEET (UG) 2021, Code P3, Q135
Amensalism can be represented as:
NCERT Table 11.1: amensalism is -/0, one species harmed and the other unaffected. +/0 is commensalism, +/+ mutualism, -/- competition.
Q5: NEET (UG) 2020, Code G5, Q47
Secondary metabolites such as nicotine, strychnine and caffeine are produced by plants for their
NCERT 11.1.4: nicotine, caffeine, quinine, strychnine and opium are produced by plants as defences against grazers and browsers. The weed Calotropis produces poisonous cardiac glycosides, which is why cattle and goats never browse on it.
Score: 0 · Answered 0 of 5
Flashcards
Tap a card to flip it over and see the answer. Tap it again to flip it back.
In a pond with 20 lotus plants, 8 new plants are added in a year. What is the birth rate?
Tap to flip0.4 offspring per lotus per year (8/20).
Tap to flip backIn a laboratory population of 40 fruitflies, 4 die in a week. What is the death rate?
Tap to flip0.1 individuals per fruitfly per week (4/40).
Tap to flip backWhat is the equation for population density at time t + 1?
Tap to flipNt+1 = Nt + [(B + I) - (D + E)], where B is natality, I immigration, D mortality and E emigration.
Tap to flip backWhat is the differential equation for exponential population growth?
Tap to flipdN/dt = rN, where r = b - d, the intrinsic rate of natural increase.
Tap to flip backWhat is the integral form of the exponential growth equation?
Tap to flipNt = N0 e^(rt), where N0 is the population density at time zero and e is the base of natural logarithms (2.71828).
Tap to flip backWhat is the Verhulst-Pearl logistic growth equation?
Tap to flipdN/dt = rN((K - N)/K), where K is the carrying capacity.
Tap to flip backWhat is the intrinsic rate of natural increase (r) for the Norway rat?
Tap to flip0.015.
Tap to flip backWhat is the intrinsic rate of natural increase (r) for the flour beetle?
Tap to flip0.12.
Tap to flip backWhat was the r value for the human population in India in 1981?
Tap to flip0.0205.
Tap to flip backWhich organisms breed only once in their lifetime?
Tap to flipPacific salmon fish and bamboo.
Tap to flip backWhat are the phases of logistic population growth, in order?
Tap to flipLag phase, acceleration phase, deceleration phase, asymptote at carrying capacity (K).
Tap to flip back